University of Liverpool
Engineering Seismology
Seismograms
Recordings at seismic monitoring stations are known as seismograms. A seismogram is a line that traces out ground movement with time, resulting in 'wiggles' when the ground shakes. This happens due to earthquakes, but also due to local noise (traffic, human activity, tides etc.). An annotated seismogram is shown below.
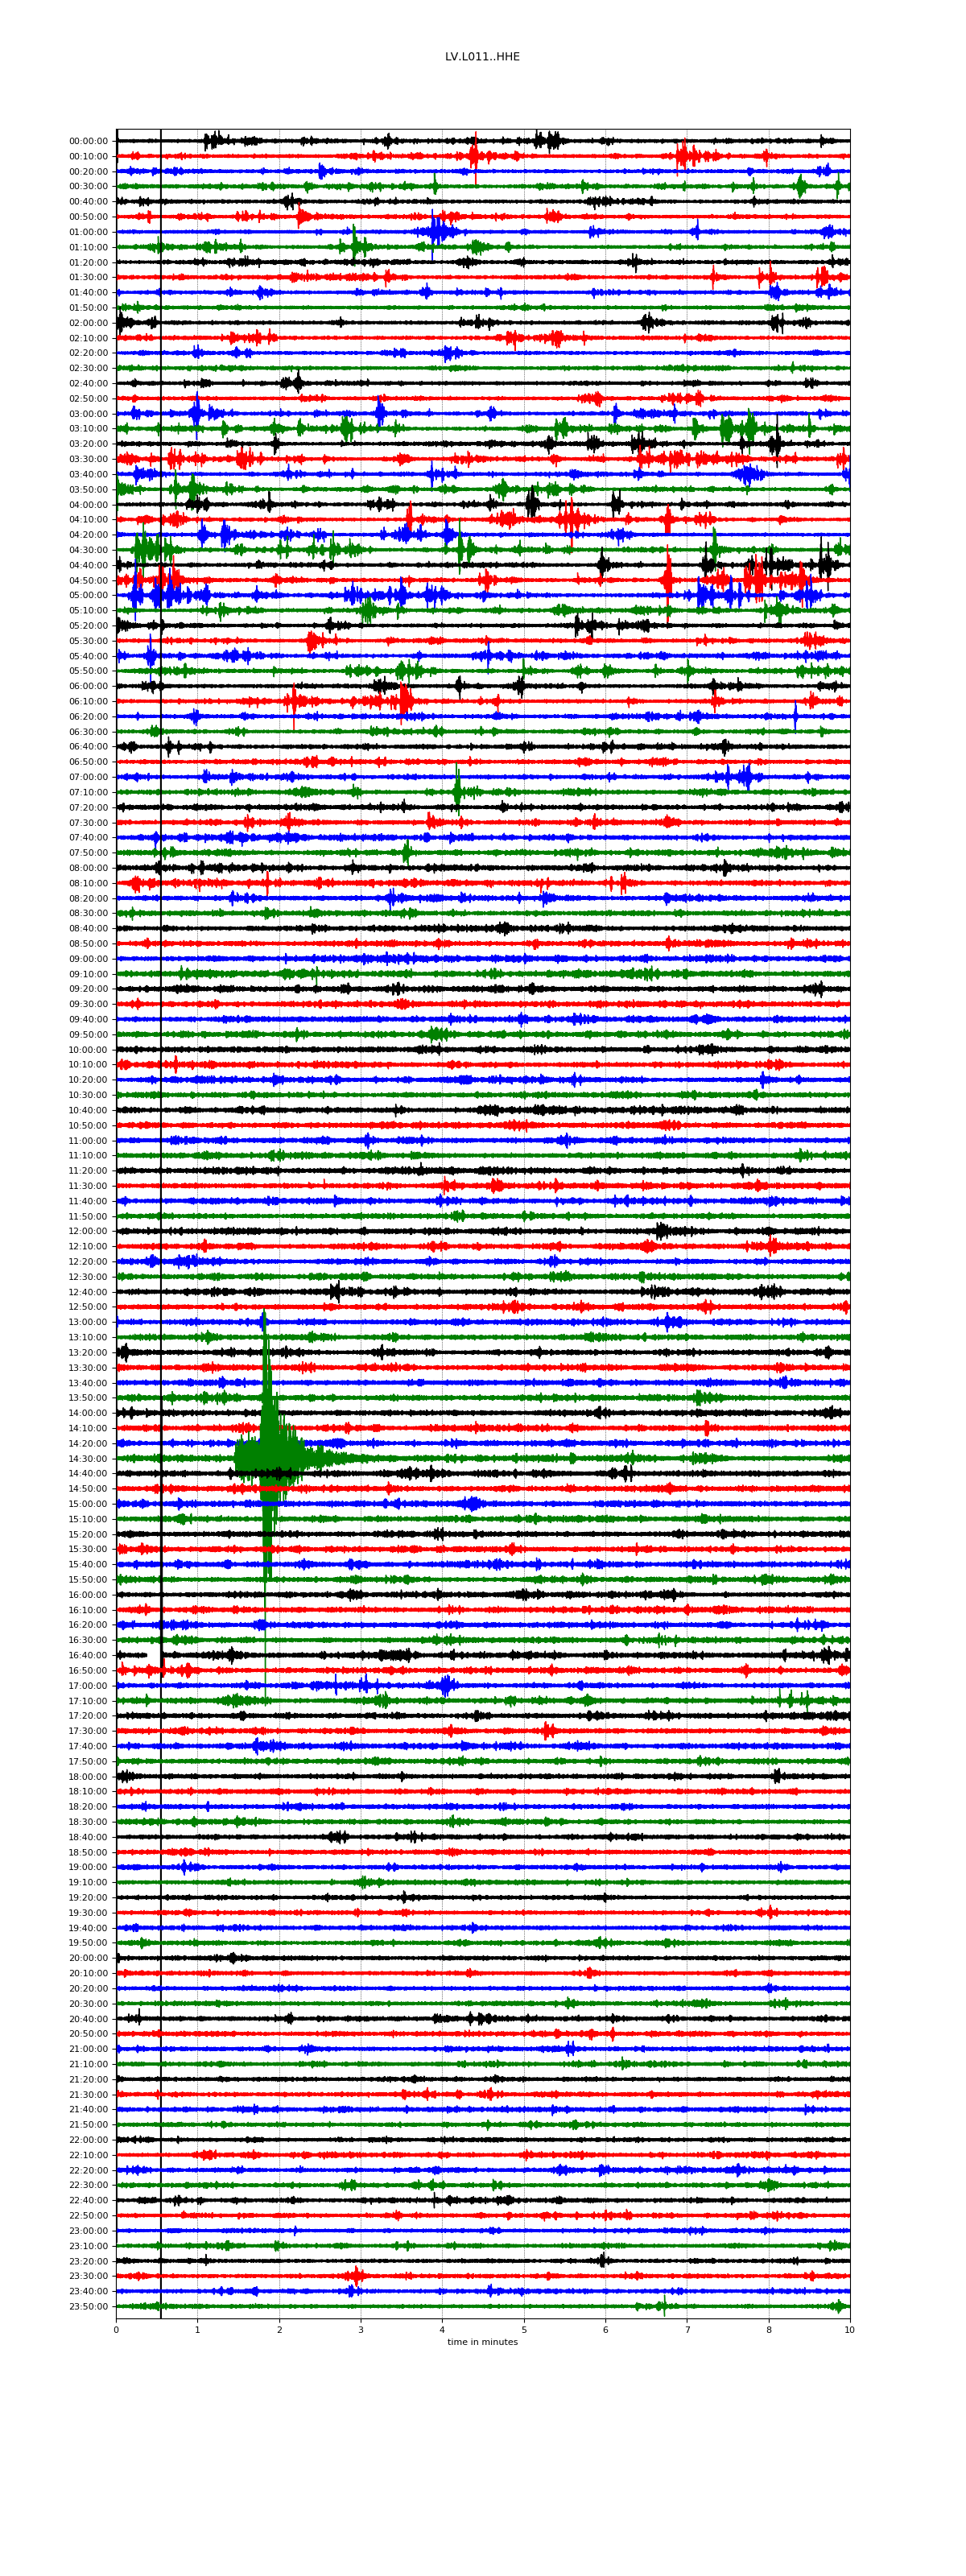
The example above is a seismogram of the February 17, 2018 M4.4 earthquake in Wales. The original can be seen here (small), and here (large). The earthquake waveform can be seen shortly after 1430. This recording was made during a test installation at the University of Liverpool.
Earthquakes can be identified from significant increases in seismogram amplitude apparent accross multiple monitoring sites at the same time. Some signals (e.g. large spikes) often occur at individual sites for various reasons and should not be confused with seismic events. All seismic events in the UK are listed by the British Geological Survey. However, not all earthquakes will be visible on this monitoring network since many will be too far away.